Why Data Growth is Spiralling Out of Control
And what people are doing about it
epistemic status: originally published on medium; reposted here as the canonical home.
Originally published on Medium: data-growth-spiralling
How Data Growth is Spiralling Out of Control, and What to Do About It
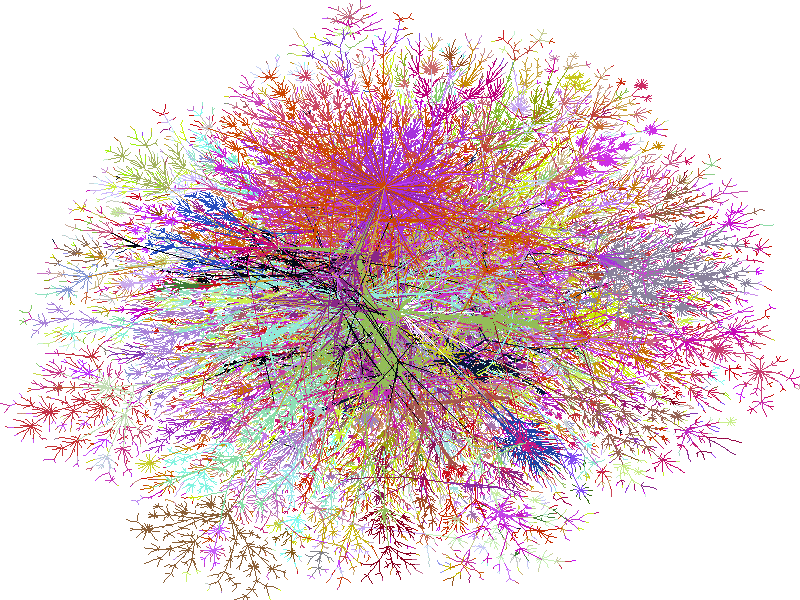
Source | Map of the internet’s connections
When the dot-com scene re-stabilized in the early 21st century, USB flash drives came onto the scene.
Ever since, we have been seeing an exponential amount of data being generated and stored worldwide, leading me to suggest that the world is becoming increasingly complex.
What I mean by that is the ever-increasing number of interactions we have with everything around us, which as you might imagine can be very hard to understand and deal with sometimes.
And what do interactions produce in return? New information!
But, exactly how much information are we talking about here? Experts put the amount of usable data existing in the world today at around 64 zettabytes in 2020.
That number rose sharply to around 175 zettabytes in 2022 — that’s a 2.7 times increase in just 2 years!
Now think about how much data a human generates every day. From every thought you have, and every action you take as a result — the medical state of your organs and your DNA in every cell…
Can you even imagine how much storage space that would take up?
Heck, the human genome alone requires around 3 GB to be stored in its entirety!
This just goes to show how the growth of data on the internet is in my opinion, spiralling out of control. We have so much data that we can’t even analyze it properly — so what do we do?
What is a Network?
Given the insane levels of data growth worldwide, scientists needed to figure out a way to understand the underlying complexity of this growth.
No scientist in the history of humankind (as far as we know) has ever had this much information to work with up until that point!
To understand this data, logically we need to somehow represent this data in a form that:
a) we can understand.
b) is representative of the interactions within the data we are dealing with.
A great candidate for achieving this understanding is Networks.
A Network is loosely defined as a system that gives different entities the means to interact with each other.
Let’s take an example, say Instagram Users. To visualize the underlying architecture of Instagram’s User Network, we can use a graph like this:
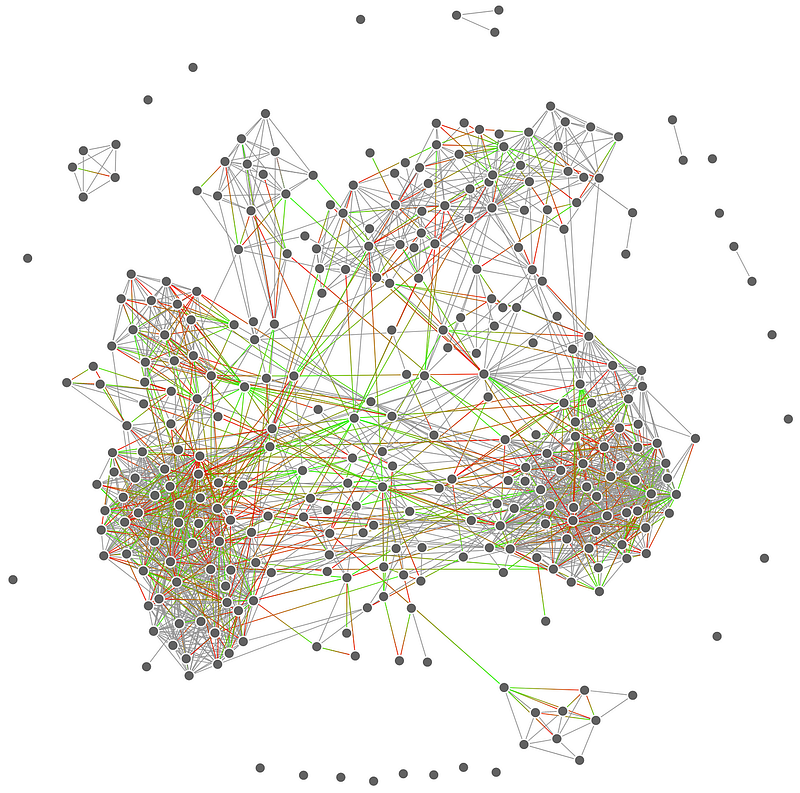
Source | Fellow writer Maxim’s Instagram Network — the Grey lines indicate that the nodes at either end follow each other, while non-grey lines indicate that a node at one end follows the other, but not the other way around.
Graphs are great at encoding abstract, complex data that is difficult to represent through other methods.
Assuming you don’t know what you are looking at right now, the black blobs are called “nodes” or “vertices”, while the lines interconnecting them are called “links” or “edges”.
In this case, every node represents an Instagram User, while each line represents a follow from one Instagram User to another.
Complex Networks typically interact in a pairwise fashion, meaning that there are “pairs” of nodes that interact through the links between each other.
As you can see, each user (node) is linked to another user through a link, which makes one pair of nodes.
Pretty much any pair-wise interacting system can be turned into a Complex Network!
You can think of Nodes as the information contained inside a Complex Network. After all networks, quite literally, encode information directly into their topology.
On the other hand, Links are the set of interactions between the Nodes of a Complex Network.
Once we have modeled our network, it’s time to analyze the data to see what insights we can get.
To do this, we will use **Network Science — **a relatively young field that uses networks to uncover network structures' key statistical and topological properties.
This helps us analyze the theoretical underlying structures and dynamics of a network, which ultimately leads us to derive insights from abundant sources of data more effectively.
The methods used to analyze a Complex Network differ from one application to another, as each may use different kinds of data with different characteristics.
Let’s keep it general by focusing on properties you will commonly find in almost all Complex Networks that can be represented as a graph, starting with universalities.
I want you to imagine the growth of the World Wide Web for the past 20 or so years.
Ever wondered why it’s called the World Wide “Web”? Well, each website has links that lead to other web pages — you can imagine that every page is a node while every hyperlink is a link connecting it to another page.
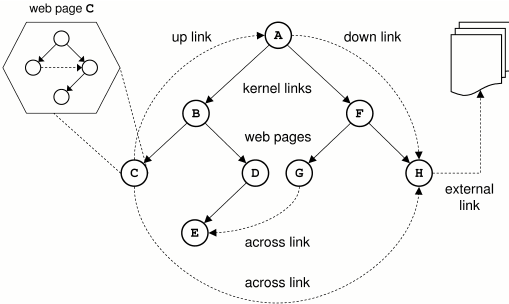
Source | A diagram showing linked web pages and their structure
Almost everyone can create a website and get it up on the web. You can’t predict in advance what people are going to put up on the internet, and how that data will interact with other data to create more data.
It’s RANDOM!
Hence we say that the architecture of a Complex Network is stochastic, meaning that it’s influenced by randomness.
A Complex Network is never built from the get-go. Node by node, edge by edge, the system evolves randomly.
Random Networks
Now here’s a question for you: can you mathematically guarantee how the internet will scale within the next 20 years?
If it were truly a system influenced by randomness, then we would have no way of telling its scale. Or would we?
Just because something is random doesn’t necessarily mean that it is unpredictable. Take, for example, a coin toss.
The result of a coin toss is random, mathematically. You have an equal chance of getting either a Heads or a Tails each time you toss.
The same goes for dice too. You have an equal chance of rolling any side of a dice.
So while we know that results can be random, we can still probabilistically say that there’s an equal chance of any result to occur. This means that, to a probabilistic degree of success, we can successfully predict many random events.
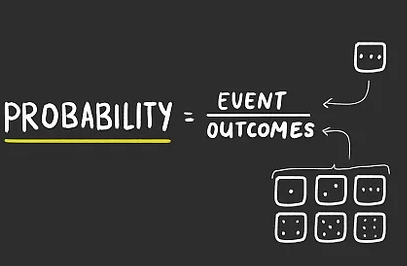
Source: Unknown | To calculate the probability of an event, divide it by the total number of possible outcomes — that’s why you have a 1/6 probability of rolling any side of a dice
Now, does this apply to the internet? Well, that’s exactly what Dr. Barabási, one of the leading scientists in Network Theory to date along with his team, set out to find out.
You see, at the time of his experiment, the internet only had a few hundred million pages, which is why the experiment could realistically be done at that time, unlike today.
Before that, scientists could only create theories of how they thought a complex network might work.
A group of Hungarian scientists created multiple papers detailing the Theory of Random Graphs. I’ll let Dr. Barabási explain this one:
…Mid 1959 and 60 they published eight papers that put down the theory of random graphs. They looked at some of the complicated networks around us and they said, “you know, we have no idea how these networks are wired together but for all practical purposes, they look like random.”
So their model was very simple. Pick a pair of nodes and throw a dice. If you get the six you connect them. If you don’t you move on to another pair of nodes.
With that idea they built what we call today a Random Network Model.
What is interesting from a physicists perspective is that for us Randomness does not mean unpredictability. Actually Randomness is a form of predictability. And that’s exactly what Erdős and Rényi proved. That in a Random Network, the average dominates.
Let me take an example. A typical person according to sociologists, has about a thousand people who he/she knows on a first-name basis. If the society would be random, then the most popular individual, the person with the most friends, would have about a thousand one hundred fifty friends or so.
And the least popular about eight hundred fifty. Meaning that the number of friends we have follows a Poisson Distribution. It has a major peak around the average, and decays very fast. Which clearly doesn’t make any sense right?
This was an indication that there is something wrong with the Random Network Model. Not in the sense that the model is wrong, but it does not capture reality. It does not capture how networks form…
In short, if the internet’s scalability were truly random, Dr. Barabási’s team would expect to see something like a Poisson Distribution, similar to the set of random network maps generated in earlier experiments years ago.
His team’s method for examining the randomness of the internet’s scalability was by looking at the number of links stemming from every website of the internet and where they link to. This is called Degree Distribution.
Surprisingly, his team found that the Degree Distribution of the internet did not follow the Poisson Distribution like with random networks, but rather a distribution of the Power Law.
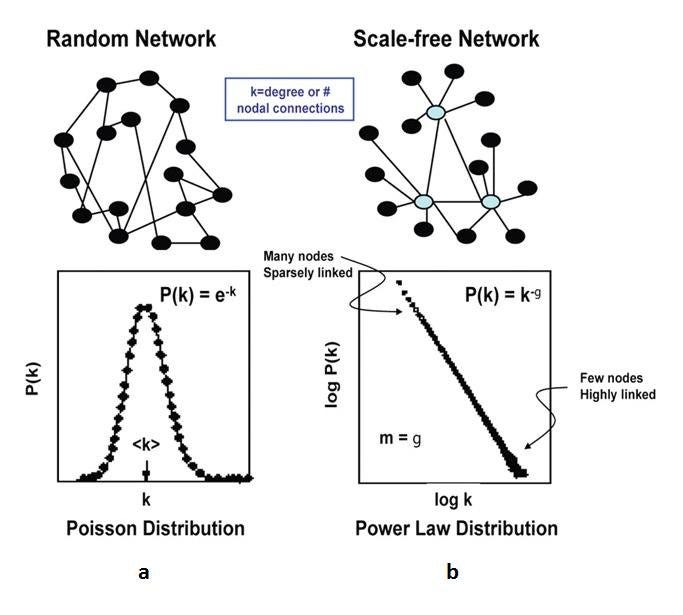
Source | Comparing Poisson Distributions (left) versus Power Law Distributions (right) for networks
And when you think about it, it makes sense. We don’t search for things randomly, we don’t just link random web pages in our online content.
Rather, we connect to what we know, which leads us to what we want to know. Some of the websites with the highest number of connected users include Google, Instagram (we came full circle!), and Facebook.
Since a lot of these nodes are social media platforms that have a strong influence on the other nodes we end up connecting to, we are essentially biased toward these particular nodes in more ways than one.
They decided to name these networks “Scale-Free” Networks, meaning that they lack averages.
Or at the very least, their averages are not meaningful, as they don’t have an intrinsic scale per se.
After all, it isn’t just the data alone that makes the world complex, as a massive repository of data that doesn’t interact wouldn’t be able to grow.
It isn’t just about connecting pre-existing nodes — it’s about generating entirely new nodes as they evolve, another key property of Scale-Free Networks.
Hence the more interactions there are, the more information is created. And the more difficult it is to find order in the chaos.
However, that doesn’t mean that they’re completely unpredictable. With enough data on the different interactions between nodes in a subset of the internet, we might find something that can shape the internet as a whole.
But that is a story for another day.
This blog is part of a series on the hardware behind Quantum Complex Networks. If you’re interested in reading more, click 👉here👈
Submit a note on this post
Notes go to a moderation queue, not a public comment thread. The author reviews them in Obsidian. Substantive notes appear on the post under a reader notes section; drive-by complaints do not.