Earthquake Detection is Useless — How About Prediction Instead?
No snake oil here, I promise 🤞
epistemic status: originally published on medium; reposted here as the canonical home.
Originally published on Medium: earthquake-prediction
Earthquake detection is useless — how about prediction instead? 🤔 ⚛️

An image generated by ChatGPT depicting sound waves being detected from the core of the earth, informing a futuristic city of hyper-intelligent beings
Introduction — The Status Quo 👀
Earthquakes are fascinating — enormous lumps of land moving about, colliding with each other to create massive shockwaves. They can occur anytime and anywhere, even in Antarctica! Such power, such awe…
However, it’s unfortunate that these same shockwaves are the direct cause of the death of 10,000 people every year, wreaking havoc on the surface that we live.
Even more deaths and countless casualties are caused by the collapse of city infrastructure, and natural disasters that result from earthquake shocks such as Landslides, Avalanches, Volcanic Eruptions, and even Tsunamis!
What’s worse is that as far as we know, earthquakes don’t come with any warnings in advance. So it’s up to us to try and analyze the data outputted from sensors and see if we can come up with a warning system ourselves.
As much as science has progressed in the last couple of decades, however, our current methods of detecting earthquakes are pretty much useless in most scenarios. With earthquake early warning systems sending out alerts only mere seconds before impact, where people stationed in the epicenter don’t even get a warning in time, it’s no wonder that there hasn’t been any significant reduction in earthquake casualties over the decades.
To understand why the performance of current Earthquake Detection systems is so bad, and how Quantum Sensors could potentially fix that, we first need to understand how Earthquakes occur in the first place.
Strap on, this is going to be a shaky ride 💺 😵
The Elastic Rebound Theory 🪨
The best theory that we have for how earthquakes occur is what’s called the Elastic Rebound Theory.
After the great 1906 San Francisco earthquake, a geologist named Harry Fielding Reid examined the displacement of the ground surface in the 50 years before the earthquake along the San Andreas Fault.
A fault is simply a discontinuity in a volume of rocks. This is caused by displacement from the sheer forces of the Earth’s giant pieces of land rubbing and sliding against each other. These giant pieces, also called tectonic plates, are what make up the Earth’s crust.

This image gives you a visual example of a fault in real life. The two colorful ridges (at bottom left and top right) of this fault in the Taklamakan Desert used to form a single continuous line, but have been split apart by movement along the fault | Source: https://en.wikipedia.org/wiki/Fault_(geology)
What he found was evidence of the ground “bending” by 3.2m, with evidence of movement by as much as 7m during that period. This led him to conclude that the quake must have been the result of the elastic rebound of the stress-energy stored in the rocks on either side of the fault.
And so, the idea of the Elastic Rebound Theory is that the two rocks on either side of a fault are constantly trying to “slip” past each other. However, due to the immense friction in between, this isn’t possible. And so instead, the rocks around the fault deform under the immense and continuous strain of energy.
Eventually, the stress increases to such high levels that it is greater than the friction holding the two rocks together. At this moment, the rocks slide past one another abruptly, snapping back into an unstrained position. This sudden movement releases a bunch of accumulated energy as shockwaves that we call “earthquakes”.
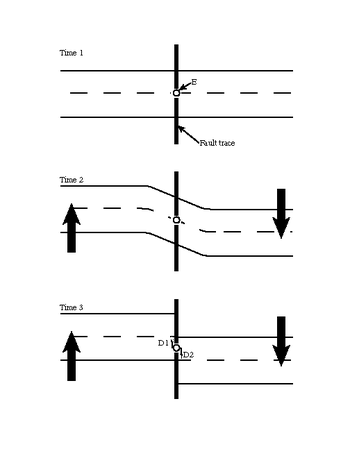
This image describes how Elastic Rebound works visually. As stress accumulates on the fault, the rock on either side starts to deform, eventually rupturing and causing an earthquake | Source: https://en.wikipedia.org/wiki/Elastic-rebound_theory
And that, ladies and gentlemen, is the Elastic Rebound Theory.
Seismic Waves 🌊
Remember the “shockwaves” that I mentioned earlier? In scientific terms, they’re called Seismic Waves.
Turns out that there are two kinds of seismic waves: Body Waves, and Surface Waves
Both play crucial roles in how energy released from an earthquake travels through the Earth, up to the surface.
Body Waves move through the interior of the Earth in three dimensions. They usually arrive before the surface waves emitted by an earthquake and are of a higher frequency than surface waves.
They can be further categorized into two types: P-waves and S-waves.
P-waves are the fastest kind of seismic wave, being the first thing that sensors usually detect. They travel at a velocity of around 5–8 km/s and can move through solid rocks and fluids. They push and pull the rock they move through, just like how sound waves compress and expand the air as they move through it.

This animation helps you visualize how P-waves travel through something by pushing and pulling | Copyright: Image ©2000–2006 Lawrence Braile
S-waves are the second kind of wave to arrive after an earthquake. They’re about 1.7 times slower than a P-wave, having a velocity of around 3–5 km/s. The biggest difference compared to P-waves is that S-waves can’t move through liquids.
Unlike P-waves, S-waves move rock up and down, or side to side. This is because they’re always perpendicular to the direction that the wave is traveling in.

This animation helps you visualize how S-waves travel through something by moving rock up and down | Copyright: Image ©2000–2006 Lawrence Braile
Next, we have Surface Waves. They travel just below the surface of the ground and travel at a speed around 10% slower than S-waves. While they may be slow, they are much larger in amplitude and are often the most destructive type of seismic wave.
They can also be further categorized into two types: Rayleigh waves and Love waves.
Rayleigh waves spread through the ground as ripples, moving both vertically and horizontally in a vertical plane, pointed in the direction the waves are traveling in. Most of the shaking felt during an Earthquake is caused by these waves.
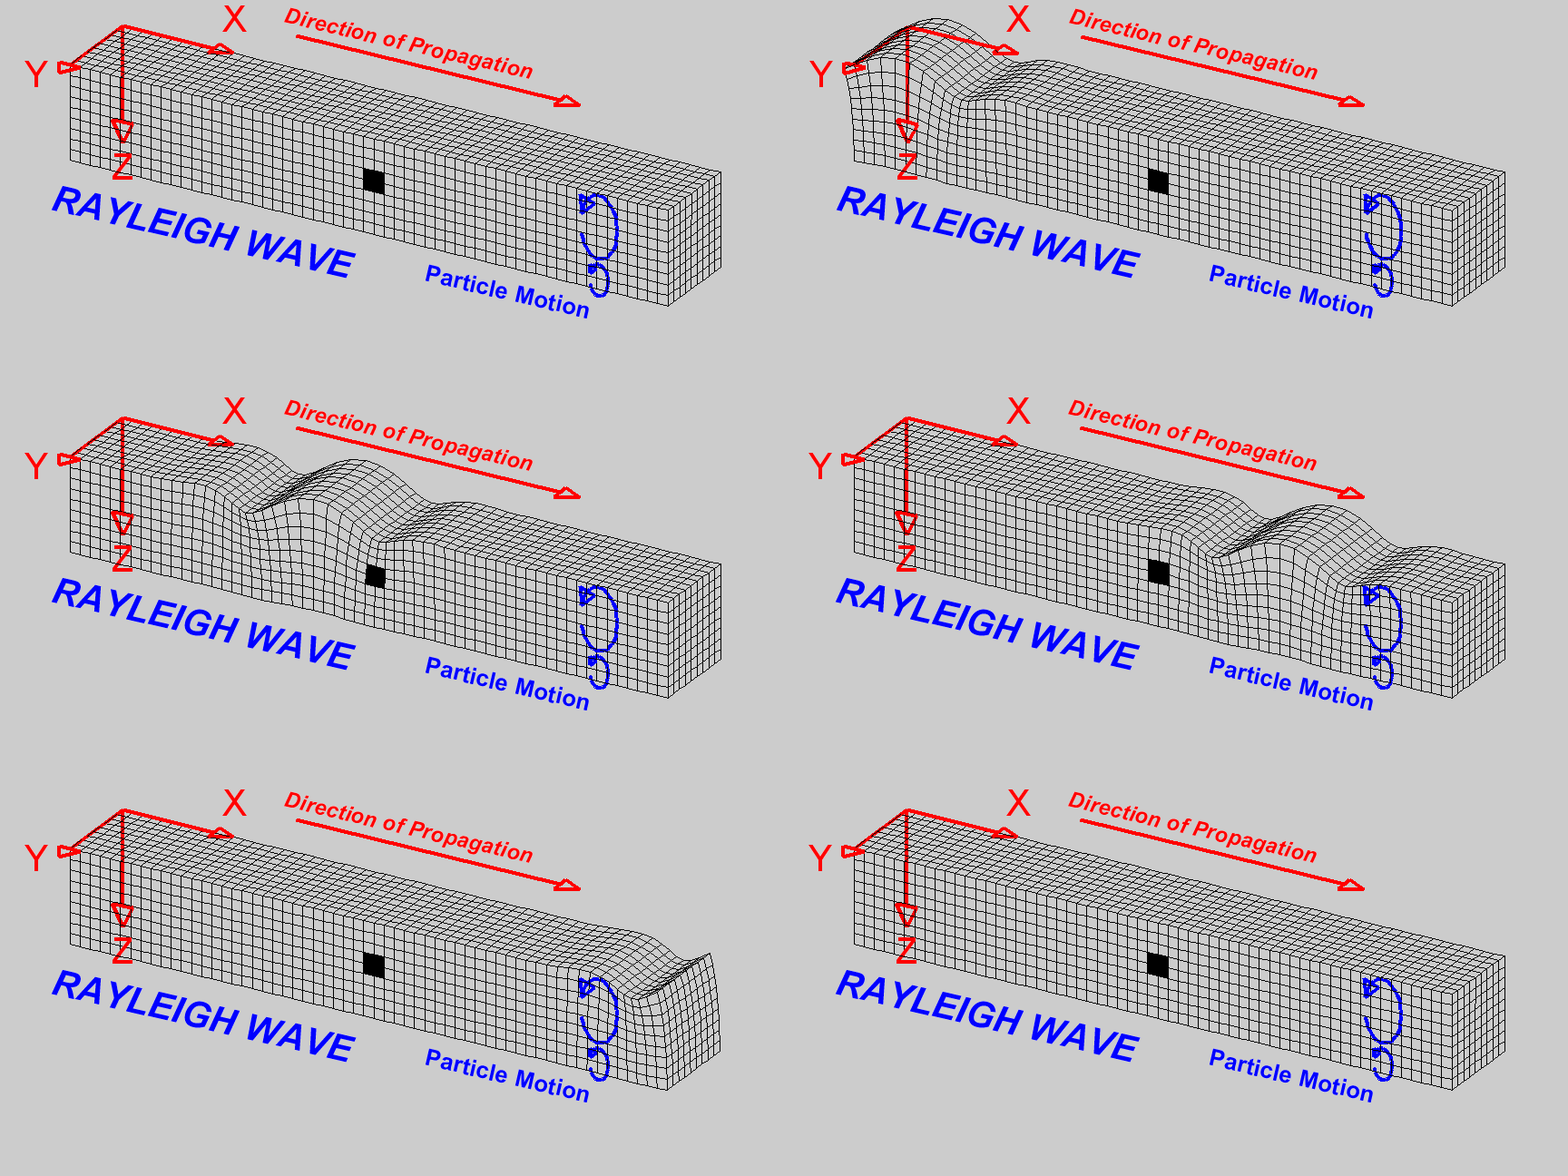
This animation helps you visualize how Rayleigh waves travel, similar to ocean waves | Copyright: Image ©2000–2006 Lawrence Braile
Love waves move the same way as S-waves do, just without the vertical displacement. Instead, they move side to side in a horizontal plane, at right angles to the direction of movement. This makes them particularly damaging to the foundations of structures like buildings.
They travel slightly faster than Rayleigh waves, but still around the speed — 10% slower than S-waves. Just like S-waves, they cannot move through liquids.

This animation helps you visualize how Love waves travel | Copyright: Image ©2000–2006 Lawrence Braile
Earthquake Detection — how does it work 🚨
We’ve talked a lot about how earthquakes work. Now, it’s time to see how technology plays a role in finding ways to detect these bursts of energy.
There are almost a dozen instruments used to monitor, measure, and detect earthquakes in some way. Because there are so many, this article is only going to focus on one: Seismometers.
Before we get into it though, there’s an important question we need to answer first; how can we tell how well an instrument is performing?
What we need is a set of metrics that will help us understand the true usefulness of Seismometers in real-world Earthquake Detection scenarios!
The first metric is how accurately and reliably the instrument can predict the date/time of an earthquake. Since we’ve already established that alerts are sent out only mere seconds before the impact, the date automatically doesn’t matter. So we’ll just be looking at the average detection time of these technologies.
The second metric is how accurately and reliably the instrument the instrument can infer the location of an earthquake. This is also pretty intuitive, as the sensors can only pick up seismic waves around it. However, it does need to infer the exact direction of the earthquake.
Moreover, some sensors may have a better range of vibration capture — we’ll loop this data point into the “location” category as well.
The final metric is how accurately and reliably the instrument can calculate the magnitude of an earthquake. This is calculated based on the Moment Magnitude Scale (MMS), a logarithmic scale for measuring an earthquake’s “size” at the source, hence its implied strength.
Ranging from 0.0 to 9.0 or larger, this scale gives the most reliable estimate of an earthquake’s size for very large earthquakes.
What do we mean by large? Well, the generally accepted Earthquake Magnitude Classes are 3.0 to 8.0 or larger. Where 3.0 is Minor and may be felt, while 8.0 or larger may expect significant damage.

This image helps you understand the various Earthquake Magnitude Classes for earthquake magnitude using this concise chart | Source: https://www.earthquakeauthority.com/blog/2020/earthquake-measurements-magnitude-vs-intensity
The largest earthquake ever recorded had an MMS reading of 9.5 — on May 22, 1960, in Chile. However, earthquakes of magnitudes 10 or larger cannot happen. This is because there aren’t any known faults on Earth that exist, big enough to generate a magnitude 10 or larger earthquake. If it did exist, it would extend around most of our planet!
It’s possible however that an Earthquake of a certain magnitude may feel quite differently. It’s like how some weather forecasts have a “feel-like” temperature, which may be hotter or colder than the actual temperature shown.
To get an idea of the feeling of an Earthquake, and its “intensity”, we need a different scale called the Mercalli Scale.
It goes in Roman Numerals, from “I” (1) being “Not Felt” to “X” (10) being “Extreme”.
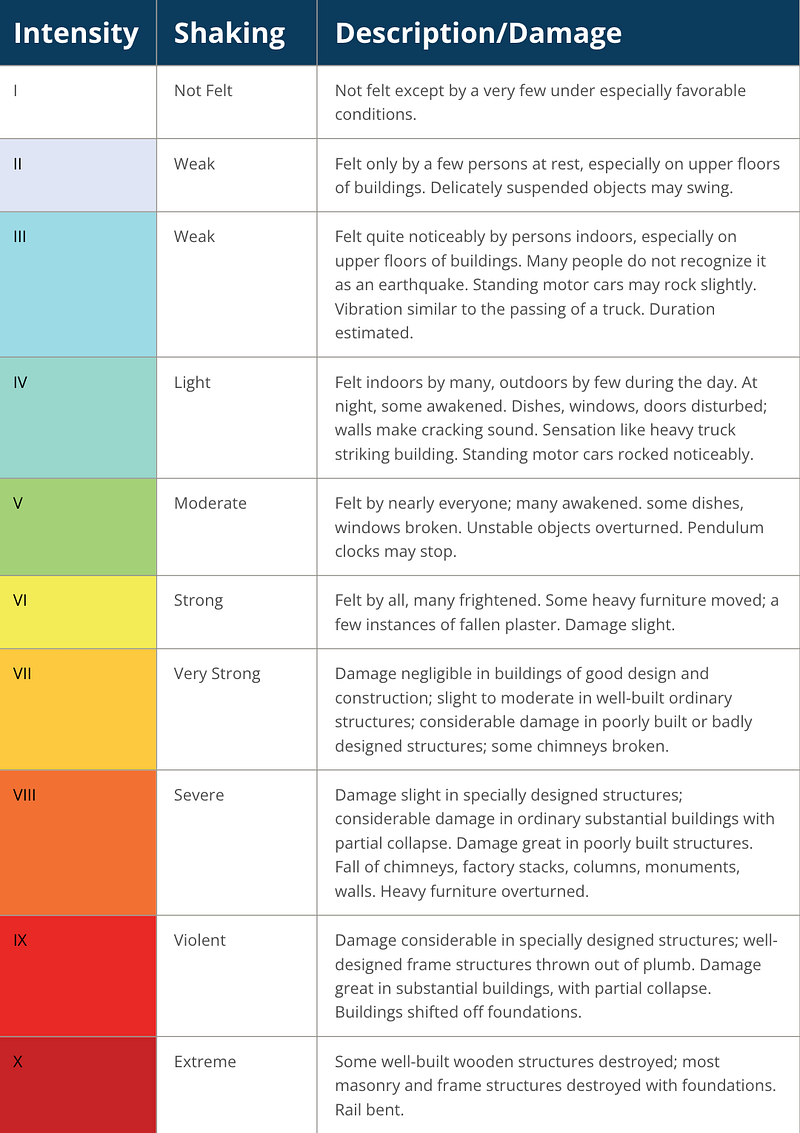
This image helps you understand the various Mercalli Scale Classes for earthquake intensity using this concise chart | Source: https://www.earthquakeauthority.com/blog/2020/earthquake-measurements-magnitude-vs-intensity
Alright. Now that we have a strong foundation for understanding the metrics with which we can compare and contrast the performance of Seismometers in real-world scenarios, let’s understand how they work!
Seismometers ⚙️
A Seismometer consists of two core components: A Timer and a Recording Device (also called a Seismograph).
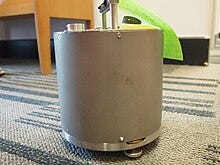
This image helps you understand what a real-life seismometer looks like, in this case, it’s a CMG-40T triaxial broadband seismometer | Source: https://en.wikipedia.org/wiki/Seismometer
The Timer is responsible for keeping the device in sync so that it can precisely measure the time it takes for the seismic waves to travel from the epicenter to the seismometer station. It can also help determine the arrival times of different seismic waves at the seismometer.
The Recording Device is responsible for recording the ground motion caused by seismic waves during an earthquake, in many cases representing that motion graphically using an amplitude-frequency graph.
The seismometer used depends on the velocity of the earthquake being measured.
As the first seismometers were entirely analog, this resulted in severe limitations on the dynamic range of those earlier devices. This meant that they were only able to detect a small section of possible earthquakes that could occur.
With the advent of digital systems, however, we were able to measure a much broader dynamic range in both categories of earthquakes.
Modern, digital seismometers come in three types: Long-Period, Short-Period, and Broadband.
Short and Long-period seismometers are incredibly sensitive. The former can effectively measure lower-intensity earthquakes over a long period, while the latter can effectively measure high-intensity earthquakes over a short period.
These days, however, most modern seismometers are Broadband. This means that they can cover a wide range of frequencies, similar to your mobile phone. They can measure frequencies from 500 Hz to detect tiny earthquakes, down to as little as 0.00118 Hz to detect very big earthquakes.
However, they often “clip” the signal or go off-scale for ground motion that is strong enough to be felt by people. This is why entire networks of seismometers (also called seismic arrays) usually house all kinds of seismometers, to get the most accurate reading depending on the magnitude and intensity of the earthquake that happens to occur.
While the sensitivity of seismometers can go up to 1/10,000,000 centimeters (almost as small as atomic spacing!), it’s not very practical unless the earthquake is occurring from a far enough distance. In contrast, 1/1,000,000 centimeters is a much more practical and common specification.
Seismometers spaced out in a seismic array can also be used to precisely locate the source of an earthquake by calculating the time it takes for seismic waves to move away from an earthquake’s source.
They are often used as part of a large-scale governmental or scientific project, such as Earthquake early warning systems that we discussed previously.
The problems with Earthquake Detection… 😰
Well, this all sounds great, right? All of these pieces of modern instrumentation surely should be able to detect earthquakes with that kind of sensitivity!
Wrong (cause if it was true, I wouldn’t be writing this article).
Let’s talk about the systems that are responsible for being at the frontlines of informing citizens about incoming earthquakes — Earthquake Early Warning Systems.
ShakeAlert is an example of such a system, managed by the United States Geological Survey (USGS). Here’s what they have to say about it 👇
“…detects significant earthquakes quickly enough so that alerts can be delivered to people and automated systems potentially seconds before shaking arrives.”
Their systems can be broadly divided into three parts: the Sensors, the Processing Center, and the Partners.
First, the sensors detect an incoming Felt Wave from an Earthquake. Then, the alert is immediately sent out to a processing center which determines the location, size, and estimated shaking of an earthquake.
Finally, if the Earthquake is considered serious enough, a message is issued to ShakeAlert partners who could produce an alert, executing automated actions and notifying people to take protective action in the few seconds that remain.
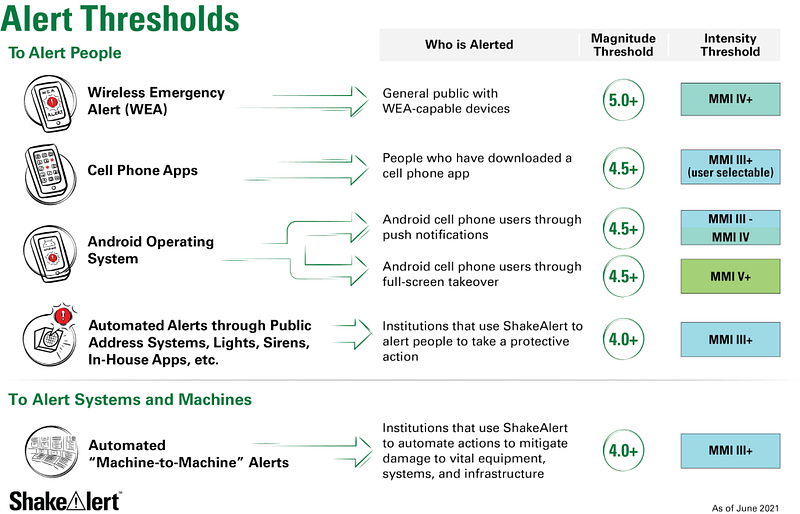
This image helps you understand ShakeAlert’s Thresholds for alerts to be sent out depending on the magnitude and intensity of an Earthquake | Source: https://www.shakealert.org/system-information/alert-delivery-thresholds/
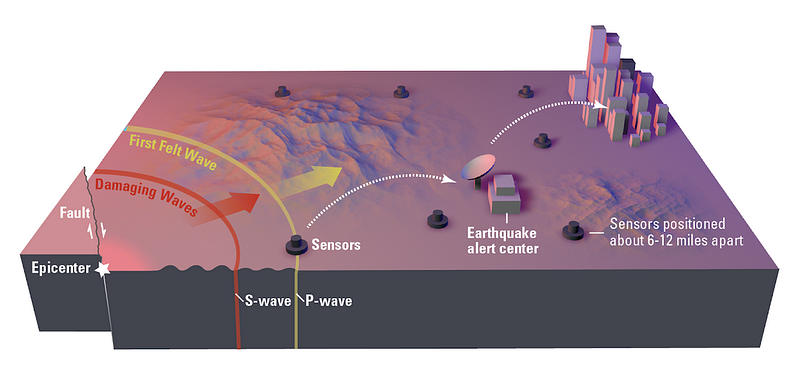
This image helps you understand how ShakeAlerts’ Earthquake Warning System works | Source: https://earthquake.ca.gov/how-it-works/
Notice me emphasizing the phrase, “in the few seconds”. Well, as it turns out, these systems are largely incapable of alerting individuals more than 40–50 seconds before an incoming earthquake. That’s not nearly enough time to prepare!
There are three reasons for this limitation.
The first limitation is ironically, sensitivity. While a seismometer's sensitivity is its biggest strength, it’s also its biggest weakness. The problem researchers are facing in the real world is differentiating noise from actual earthquakes. Hence to get an accurate detection, earthquakes need to be louder than the surrounding noise to be detected clearly.
The second limitation is money. A single sensor just isn’t enough to monitor earthquakes across the US, for example. A network of sensors is required to ensure wider coverage of the entirety of multiple fault zones so that earthquakes anywhere can be detected just in time.
Currently, the USGS has 15 regional seismic networks across the country creating what’s called the Advanced National Seismic System (ANSS). While that may seem like a lot, in a report on Current Status, Development Opportunities, and Priorities for 2017–2027, they noted that they would require an additional moderate fund of around $6 Million every year to deploy additional seismic sensors to support their operation of covering areas of high seismic hazard such as the Intermountain West and Alaska.
The final limitation, the most important in my opinion, is physical limitations.
Let’s do some simple math together. Earthquakes can occur up to a depth of around 800 km. We know that on average, P-waves travel at a velocity of around 6.5 km/s, S-waves travel at a velocity of around 4 km/s, and Surface waves travel at a velocity of around 3.6km/s. How much time will it take them to reach the surface?
If we assume that earthquakes occur at the deepest possible point in our data, which is 800km, it will only take 123 seconds for the P-waves to reach the surface, 200 seconds for the S-waves to reach the surface, and 222 seconds for the Surface Waves to reach the surface. That’s the best-case scenario!
So even if we were able to somehow detect earthquakes the instant that they started, we would still not have much time to prepare in advance.
Well, seems like we’re stuck. So what’s the solution then?
Let’s try to look at this from an idealistic point of view. We want to ensure more timely, accurate alerts for public hours or even days in advance. It’s clear from our data that earthquake “sensing” alone isn’t going to cut it if we wish to announce incoming earthquakes earlier.
So, what if we can see earthquakes coming before the effects of Elastic-Rebound even take place?
One word: Prediction.
Promising Research ✨
Believe it or not, earthquake prediction has been around for centuries. Unfortunately, pretty much all of these methods weren’t exactly the most scientific…
However, back in August of 2023, a paper was published by two French scientists named Quentin Bletery and Jean-Mathieu Nocquet, which rocked the world with their findings.
In short, they claim that large global earthquakes do have a short-term precursory phase that can be identified using GPS data.
Yes, GPS data! They measured the visible displacement of the ground using 3,026 high-rate GPS devices 48 hours before 90 earthquakes that occurred with a magnitude greater or equal to 7.0 on the MMS.
What they found was that this method of detecting large earthquakes reveals a 2-hour-long exponential acceleration of slip before they rupture, which improvements in measurement precision and density could help detect more effectively 🤯
I should point out that there have been some gripes expressed by scientists who peer-reviewed the paper. One of the gripes repeatedly expressed is the 2-hour value itself, as the paper doesn’t make it very obvious how they got to that conclusion.
Regardless, if you’re interested in learning more, I highly suggest that you read the paper by clicking 👉here👈.
My Thoughts 🤔
Currently, the USGS says, and I quote:
“Neither the USGS nor any other scientists have ever predicted a major earthquake. We do not know how, and we do not expect to know how any time in the foreseeable future.”
The word “prediction” has always been associated with delusion or wishful thinking, with false prophecies often preying on people’s hopes and fears, fueled by ignorance and superstition.
Despite countless failed prophecies, there have been, and still are, a lot of unscientific people who claim to be able to predict earthquakes.
Nevertheless, I believe that with the advent of breakthroughs in Quantum Sensing like detecting earthquakes using Fiber Optic cables and using quantum optical sensors for determining the earth’s gravity field from space, there is going to be an incredible amount of advancements in earthquake prediction, causing a massive change in how the scientific community perceives the topic of earthquake prediction as a whole.
That last sentence about measurement precision and density in the paper? This, is where Quantum Sensing is going to come into play.
By deploying more precise sensors in a higher quantity, and creating the next generation of earthquake prediction networks, the kind of data that we would be able to retrieve is just unimaginable! Who knows what kinds of new insights we might stumble upon…
In my next article, I’m going to be diving deeper into reviewing the paper made by these two scientists, addressing the gripes that reviewers expressed about their paper, and explaining in detail how Quantum Sensors could potentially improve the quality of data gathered from areas of high risk, all to predict earthquakes faster, and more accurately.
As always, I hope that with my work, I can continue to improve upon what’s already been done, while inspiring a new generation of quantum enthusiasts to leverage quantum technologies in tackling some of the world’s biggest problems.
Submit a note on this post
Notes go to a moderation queue, not a public comment thread. The author reviews them in Obsidian. Substantive notes appear on the post under a reader notes section; drive-by complaints do not.